America's
worst-connected cities are also the poorest, pretty much.
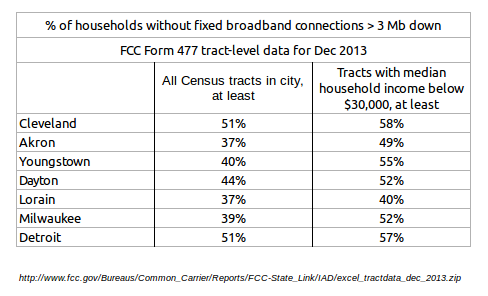
The 2013 American Community Survey shows 72 U.S. cities with 100,000 households or more. Here are the fifteen with the highest percentages of households with no Internet access of any kind, including mobile or dial-up.
The rightmost column shows each city's rank among the 72 in median household income, lowest to highest. (The median for all U.S. households was $51,017.)
Remember, "median income" means
half of all households made less.
So... pretty straightforward, yes?
And not surprising. There's plenty of evidence
of correlation, if not causation, between low income and lack of Internet access and use.
Does this correlation prove that the cost of broadband service is the main reason so many households still don't have it? Nope, not by itself.
But bear in mind that it's pretty hard in most communities to buy any kind of Internet connection, including "non-subscription" smartphone service, for less than $25 a month... which is not small change for a household with only $1200 or $1500 a month to live on.