On June 14 the FCC released its semi-annual report on "Local Telephone Competion and Broadband Deployment", based on providers' Form 477 filings from June 2013. As usual, the new report includes data comparing the number of home broadband connections, as reported by the providers, to the total households in each county and Census Tract.
But something new has been added. For the first time, the FCC has provided its broadband-connections-to-households comparison using a meaningful definition of "broadband" speed -- at lead 3 mbps down and 768 kbps up.
While still conservative for 2014, this new benchmark tells us, for the first time, about Americans' access to a level of home Internet access that's actually worth paying for.
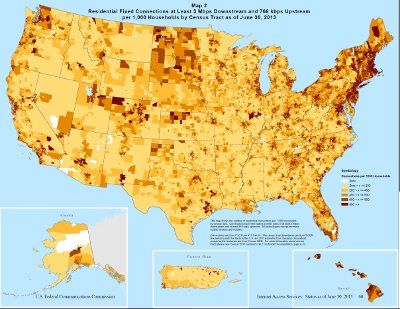
Here's the new report's national map of "Residential Fixed Connections at Least 3 Mbps Downstream and 768 kbps Upstream per 1,000 Households by Census Tract".
Here's a closer view of Ohio.
And here's my own more detailed map of Cleveland and Cuyahoga County, highlighting the tracts where reported broadband connections in June 2013 accounted for fewer than 40% of total households.
